
At Car Rental Gateway, we analyzed thousands of bookings across the 16 FIFA World Cup 2026 group-stage host cities. The analysis compared rental pickup dates around each city’s first hosted match with the same weekdays one year earlier.
By Hannes Põldvee, Product and Sales Manager, Car Rental Gateway
The FIFA World Cup 2026 is already starting to appear in car rental booking data. At Car Rental Gateway, we analyzed thousands of bookings across the 16 FIFA World Cup 2026 group-stage host cities. The analysis compared rental pickup dates around each city’s first hosted match with the same weekdays one year earlier.
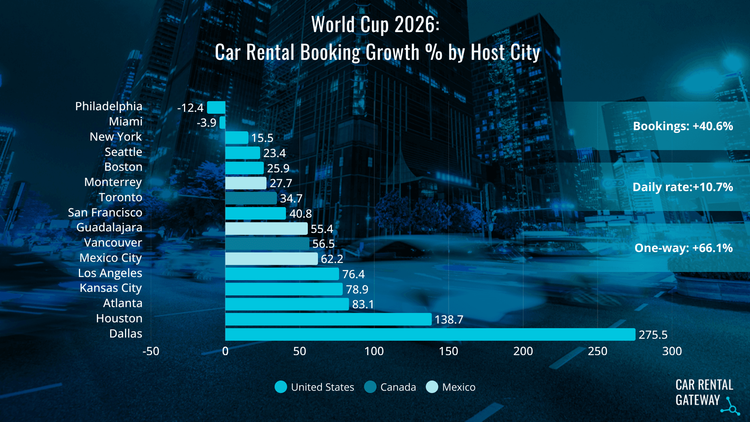
Across those host cities, car rental pickups were up 40.6% around match day. That headline number matters, but it is not the whole story. For rental operators, brokers and mobility platforms, the more useful insight may be how differently the impact appears from city to city, and how customers seem to be shaping their trips around the tournament.
Canada was one of the more interesting regional signals. Vancouver saw pickups increase 56.5%, while Toronto was up 34.7%.
Those increases are not the largest in the dataset, but they are still useful because of the timing. Canada’s first host-city matches came in mid-June, before the strongest July and August tourism period. That makes the lift easier to see against the seasonal baseline and suggests the tournament is already visible in rental pickup behaviour.
Mexico also showed clear growth. Mexico City was up 62.2%, Guadalajara was up 55.4%, and Monterrey was up 27.7%.
The U.S. picture was more mixed. Dallas was one of the strongest movers, with bookings up 275.5%. That percentage should be read with some care because the prior-year base was smaller than in the largest U.S. hubs. Still, the increase is notable, especially when viewed alongside Dallas’ strong early group-stage fixture mix, including matches involving the Netherlands, England and Argentina.
Fixture strength appears to matter. New York (NY NJ Stadium) opened with Brazil vs Morocco and saw pickups rise 15.5%. Philadelphia opened with Côte d’Ivoire vs Ecuador and was down 12.4% in the data.
That does not mean the team draw explains the full difference between the two locations, but it does suggest that the teams, fanbases and host-city profile can shape how strongly a major event appears in rental demand.
One of the most interesting findings was not simply that more people rented cars. It was how they used them.
Across the 16 host cities, average booking duration increased 18.9%. One-way bookings were up 66.1%.
That points to a different type of tournament travel. Some customers may not be flying into one city, watching one match and returning from the same location. They may be picking up a car in one location, following the tournament, visiting other destinations and returning the vehicle somewhere else.
For rental operators, that has practical implications. Major events can affect fleet demand before, during and after match day. One-way bookings can create vehicle imbalance between locations. Longer rentals can reduce vehicle availability during peak windows. Demand can also vary widely depending on the teams playing, the size of the fanbase, local transport options and the existing tourism season.
Pricing was more modest than the pickup growth. Across the host cities, average daily rate was up 10.7%. Some cities rose more than others, but vehicle mix can affect average daily rate, so it should not be read as pure demand pressure.
The main takeaway is that large sports events do not create one clean demand pattern across every host city. The World Cup appears to be shaping rental behaviour in different ways by market.
Tickets, hotels and flights usually get most of the attention around major events. Car rental data adds another layer: how people actually move once they arrive.
***
Methodology behind the analysis:
- We analyzed car rental pickup dates across a nine-day window: seven days before through one day after each host city's first group-stage match.
- Year-over-year comparisons were made against the same window in 2025, shifted back exactly 364 days to keep the days of the week aligned.
- Daily rates were calculated as total booking price divided by rental length, with same-day rentals counted as a minimum of one day.
- The overall growth figure compared total bookings across all observed cities and periods in 2026 vs. 2025. Other metrics used a volume-weighted geometric mean to account for differences in market size.
- For cities that had hosted multiple matches by publication, only their first match was used to keep comparisons consistent.